big data isn't about bits, it's about talent
Monster has a solid reputation of providing pivotal content not only about finding the right career opportunity but hiring the perfect fit for your organization.
Our content team always wanted to take our data from thousands of polls, surveys, and our internal data, to build a product where our users go for valuable information. Our research found that our employer base is hungry for more content about the industry. However, not everyone has the time to find available and pertinent articles across the web.
The big problem we wanted to solve was how do we not inundate our users with more information, yet have a place where it's filtered for a very narrow, yet helpful, perspective.

Site map from hiring.monster.com/monster-intelligence
let's make data exciting
Define the Objective
If there was ever a project that I worked on that was written down on a soaked napkin, this was it. Our Senior Content Creator wanted to take data from our Data Analytic team and feature those findings on social media. After looking hard at all the compiled findings, he wanted to make an entire landing page.
This took a grass-roots approach to figuring out how to make this work with our existing Information Architecture. We needed a solid foundation as to why this would work.
Objective: To analyze hiring trends, keyword searches, and community insights on Monster.com to provide valuable information to employers, job seekers, and industry analysts.

Wireframe built using Figma
I started my career as a UI and visual designer, and because of that, I wanted to accept the challenge of placing this project squarely on my shoulders. Even though UI is an aspect of an overall UX experience, both are critical for creating successful and user-friendly designs, but they focus on different aspects of the overall user experience.

We needed to find another way to target that audience, and a podcast sounded like a fantastic vehicle to drive traffic, uncover new customers and increase conversions. And as far as data is concerned, our customers are equally as hungry for that information.
Collect and Analyze Data
Research

User Experience

Prototyping

Visual Design

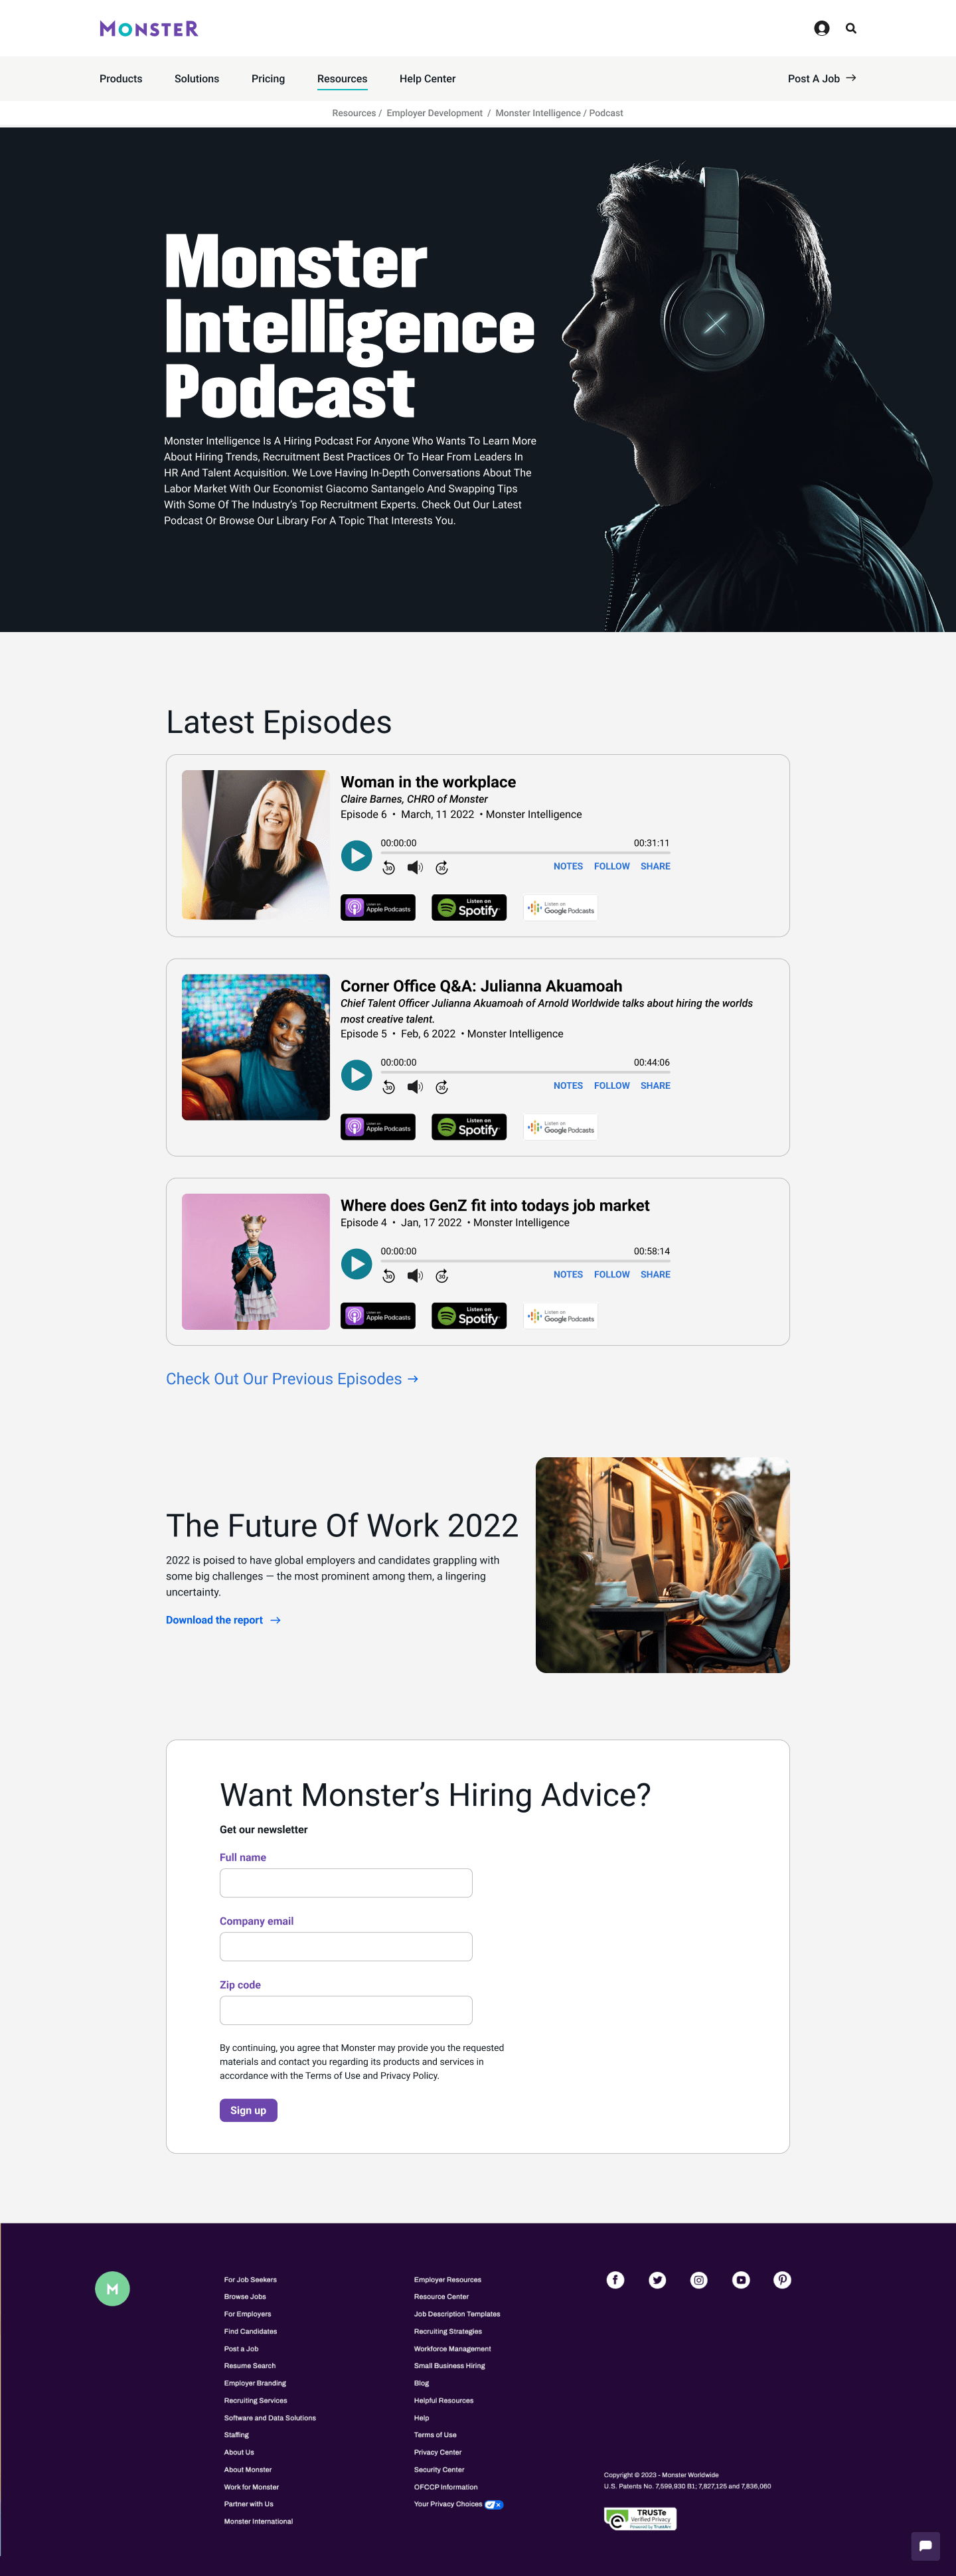
Integrating our podcast
Separate studies show that podcast listeners display massive engagement rates (76%) similar to that of listeners of the weather or the news (both 79%), putting them far ahead of people watching TV (56%) or using social media (50%).

Our poll results, which we conduct throughout monster.com, were profoundly interesting to our users. By using some of these criteria, hiring managers said they could write job descriptions that are clear, concise, and accurate. This will help them attract the best candidates for the position and fill the role quickly and efficiently.

User Engagement:

Time Spent on Page was consistently higher than traditional pages.
Interaction Metrics such as clicks on links, buttons, or multimedia elements surpassed our KPI's and expected results.
Conversion Rates:

Conversion Tracking also outperformed expectations. Signing up for our newsletter, completing a form, and engaging with our podcast led to a higher conversion rate above our KPI's by 5%.
Bounce Rate:

The bounce rate on this product was relatively low, coming in at 32%. I believe that this was due to users finding the content or design compelling enough to explore further.
conslusion
In conclusion, the analysis of hiring trends, keyword searches, and community insights on Monster.com reveals significant shifts towards remote work and advanced technical skills. Employers and job seekers can leverage these insights to better navigate the evolving job market. Continuous monitoring and adaptation will be key to staying ahead in this dynamic environment.